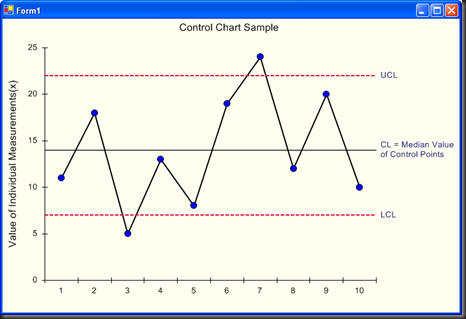
衡量隨時間變化的流程結果,並以圖表形式顯示結果。管制圖是衡量差異的一種方法,目的是確定流程差異是否在控制中或失去控制。
管制圖以樣本差異衡量為依據。從選定做衡量的樣本中可決定平均數與標準差。「執行品質控制」通常維持在正負三個標準差之內(99.73%)。
管制圖最常用於製造環境中重複性活動容易監督之處。
The control chart is a Run Chart with statistically determined “upper” and “lower” control limits on either side of the “average” line.


發表留言